Journal Article
Identifying climate and environmental determinants of spatial disparities in wheat production using a geospatial machine learning model
https://doi.org/10.1080/15481603.2025.2533487Overview
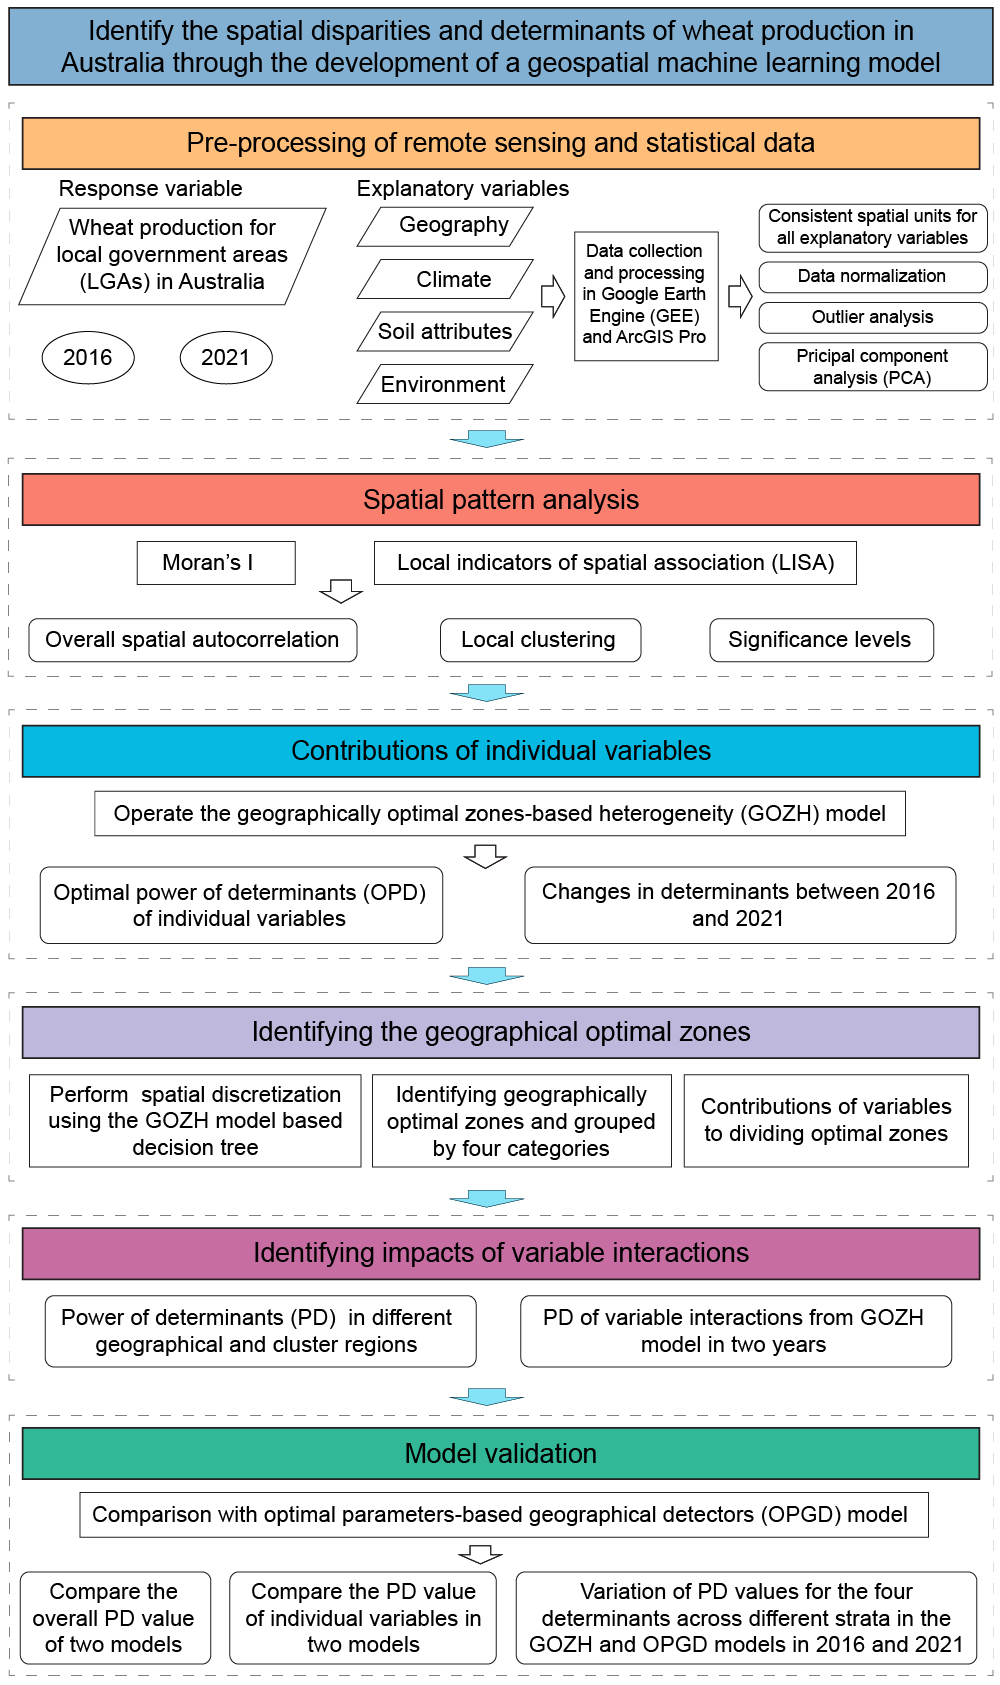
This paper builds a geospatial machine learning workflow that combines hotspot detection, geographically optimal zones-based heterogeneity (GOZH), and determinant interaction analysis to explain why wheat production varies across Australia and how the dominant controls changed between 2016 and 2021.
Abstract
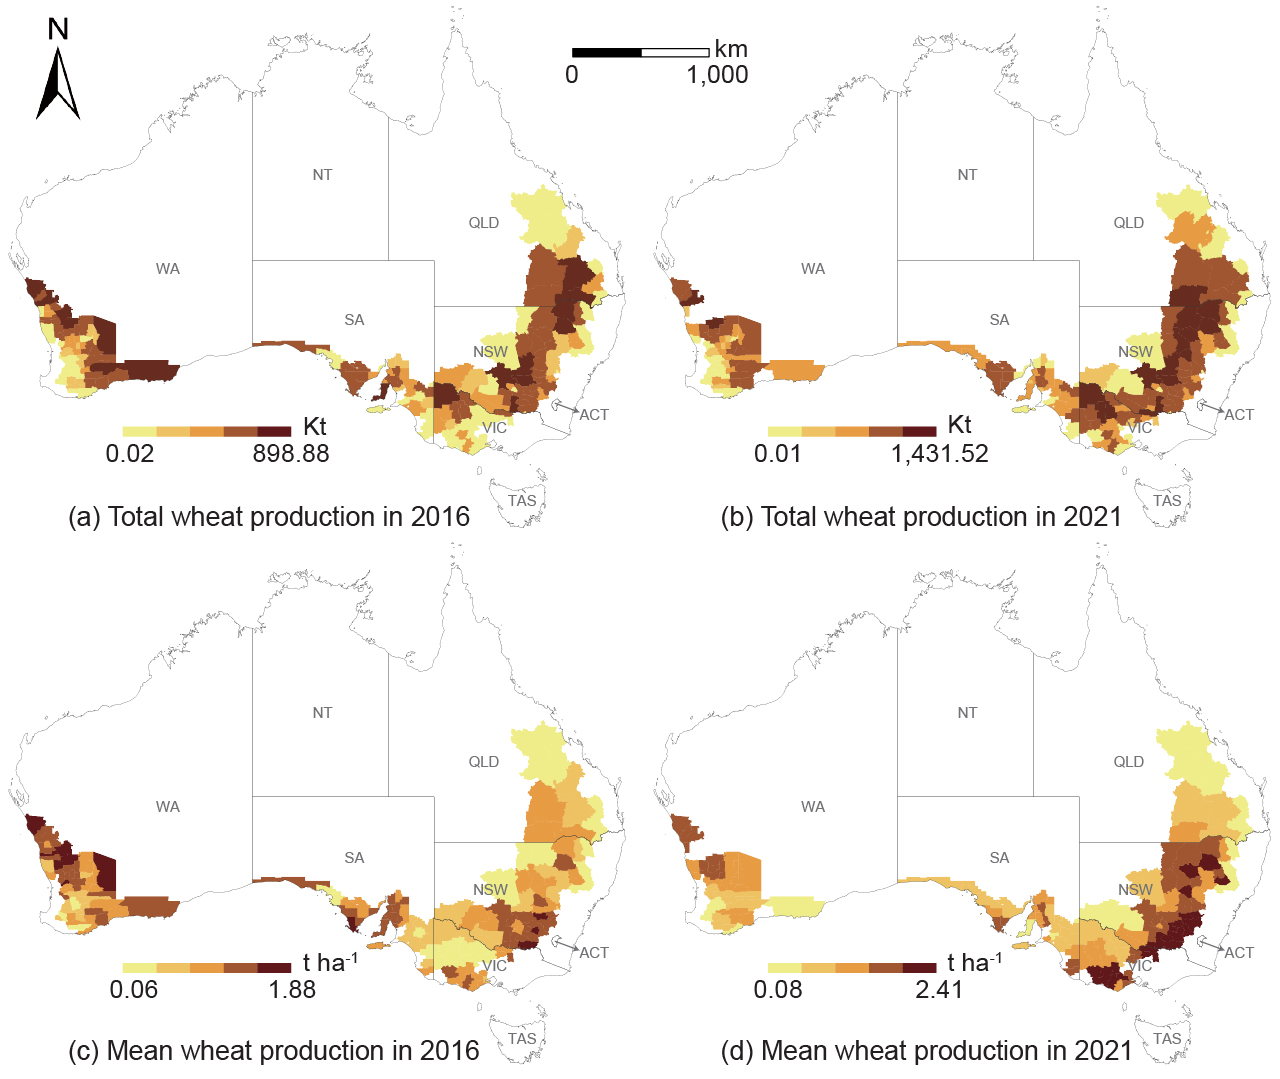
Wheat production is crucial in global food security and sustainable development, especially under severe global climate change, frequent extreme weather events, and significant population growth worldwide. A deeper understanding of spatial variation in wheat production and its determining factors is essential for implementing different cultivation practices, water and fertilizer management, and adaptive variety selection across different regions. However, existing methods primarily focus on identifying single-variable factors while lacking geographical spatial characteristics, which may lead to an incomplete exploration of spatial disparities in wheat production, predictions, and responses to changes in determining factors. This study develops a geospatial machine learning model by integrating spatial autocorrelation, spatial stratified heterogeneity, and decision tree learning to identify spatial disparities of wheat production and their determinants. The model is applied to wheat production analysis in Australia, the world's fifth wheat-producing country in 2022. First, a spatial autocorrelation method is employed to identify hotspot areas of wheat production in Australia. Next, the geographically optimal zones-based heterogeneity (GOZH) model, which integrates spatial stratified heterogeneity and decision tree learning, is used to identify determinants and their interactions that drive spatial disparities in wheat production. Finally, the developed geospatial machine learning model is evaluated by comparing its effectiveness with the commonly used geographical detector model. The results demonstrate pronounced spatial heterogeneity in Australian wheat production driven by environmental, climatic, and soil factors and their interactions. Identifying these spatial determinants enables more efficient crop management - such as targeted sub-regional practices, climate-adaptive variety selection, and soil health strategies - thereby supporting food security and sustainable agricultural systems.
Method Implementation
The implementation combines spatial autocorrelation diagnostics, geographically optimal zones-based heterogeneity (GOZH), and a geographical detector comparison to explain spatial disparities in Australian wheat production.
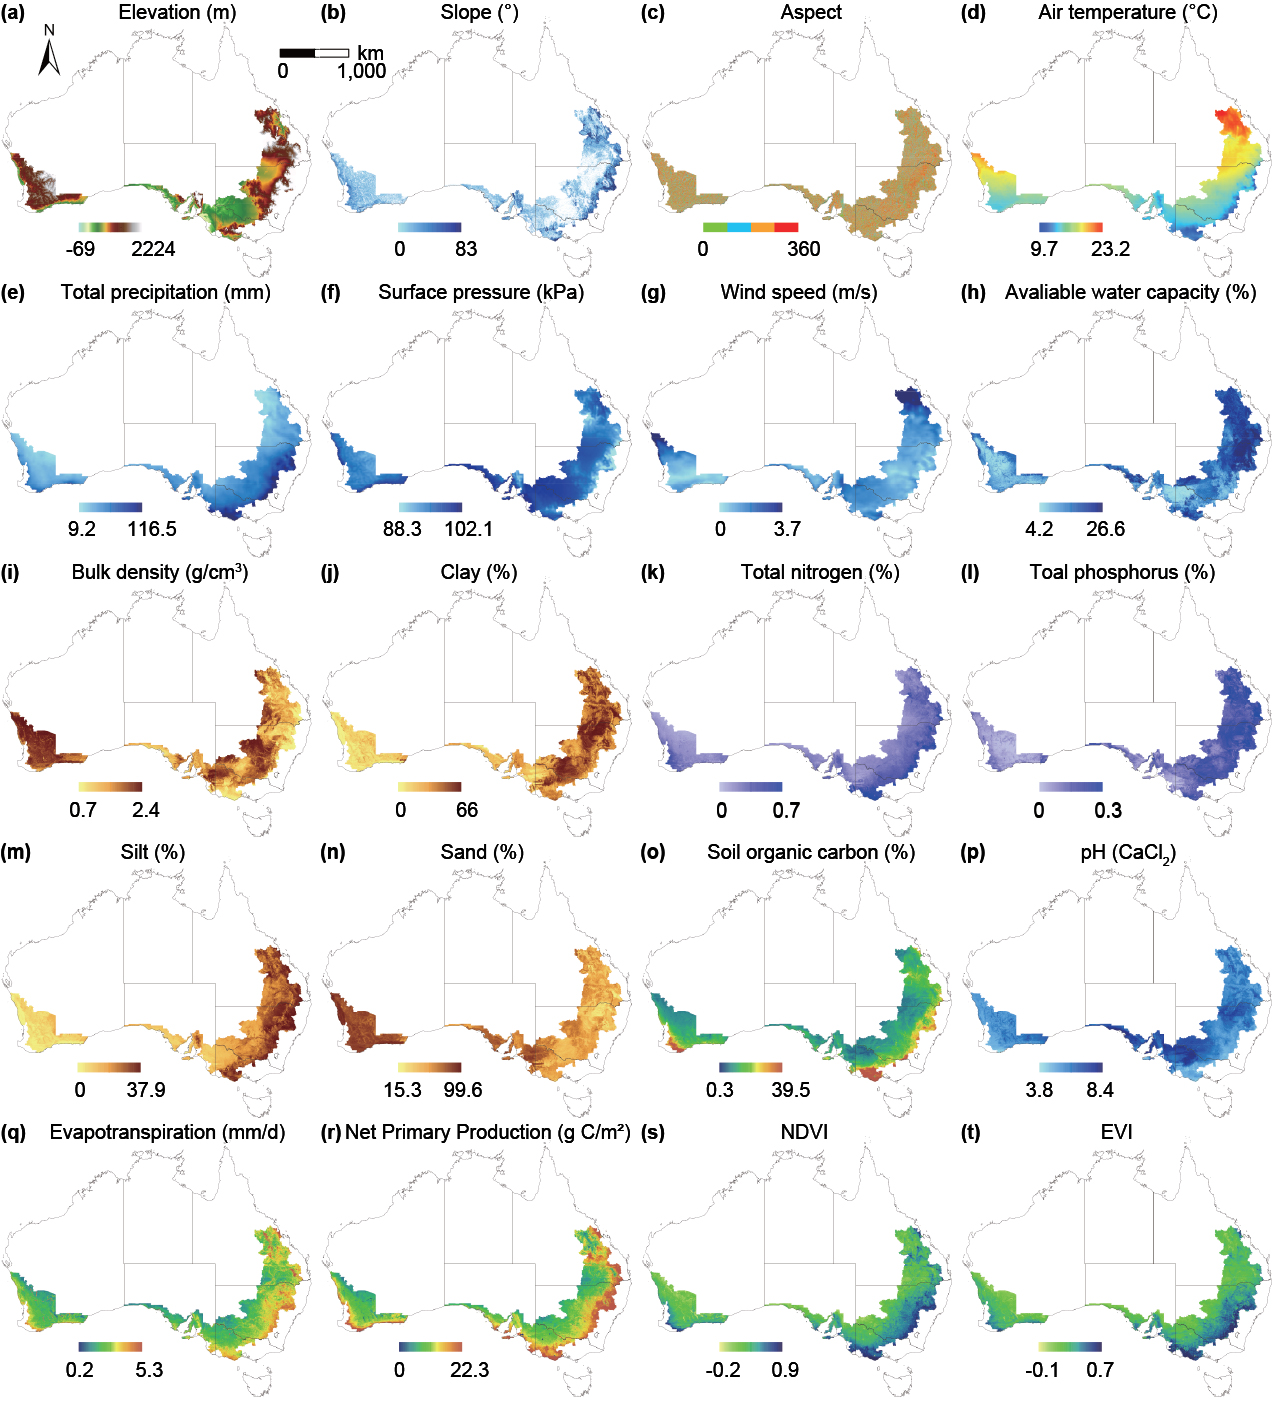
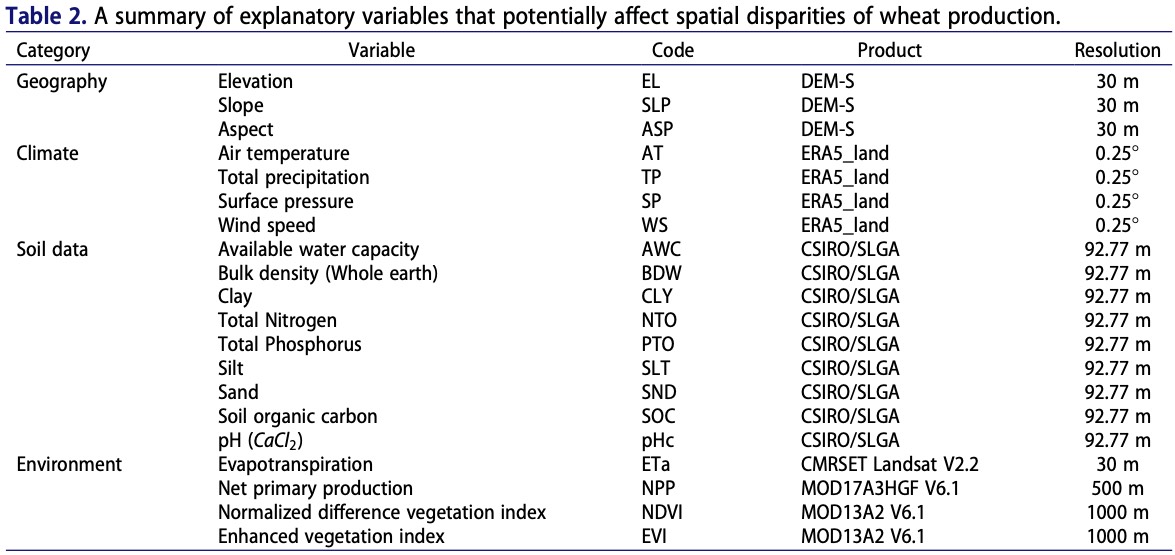
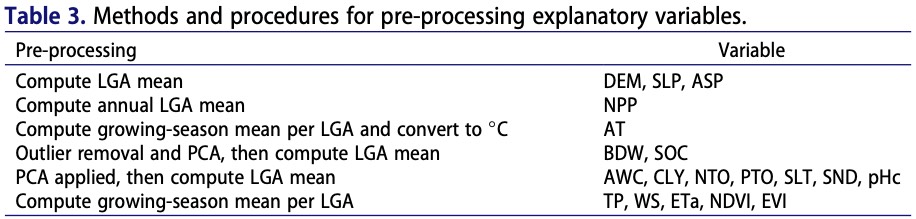
- Preprocess wheat production and explanatory variables. Wheat production and 20 explanatory variables are aligned to Local Government Areas (LGAs). Climate, soil, geographic, and environmental variables are standardized by LGA means; temperature is converted from Kelvin to Celsius; soil outliers are removed using a 2.5 standard deviation threshold; and PCA is used to reduce layered soil attributes.
-
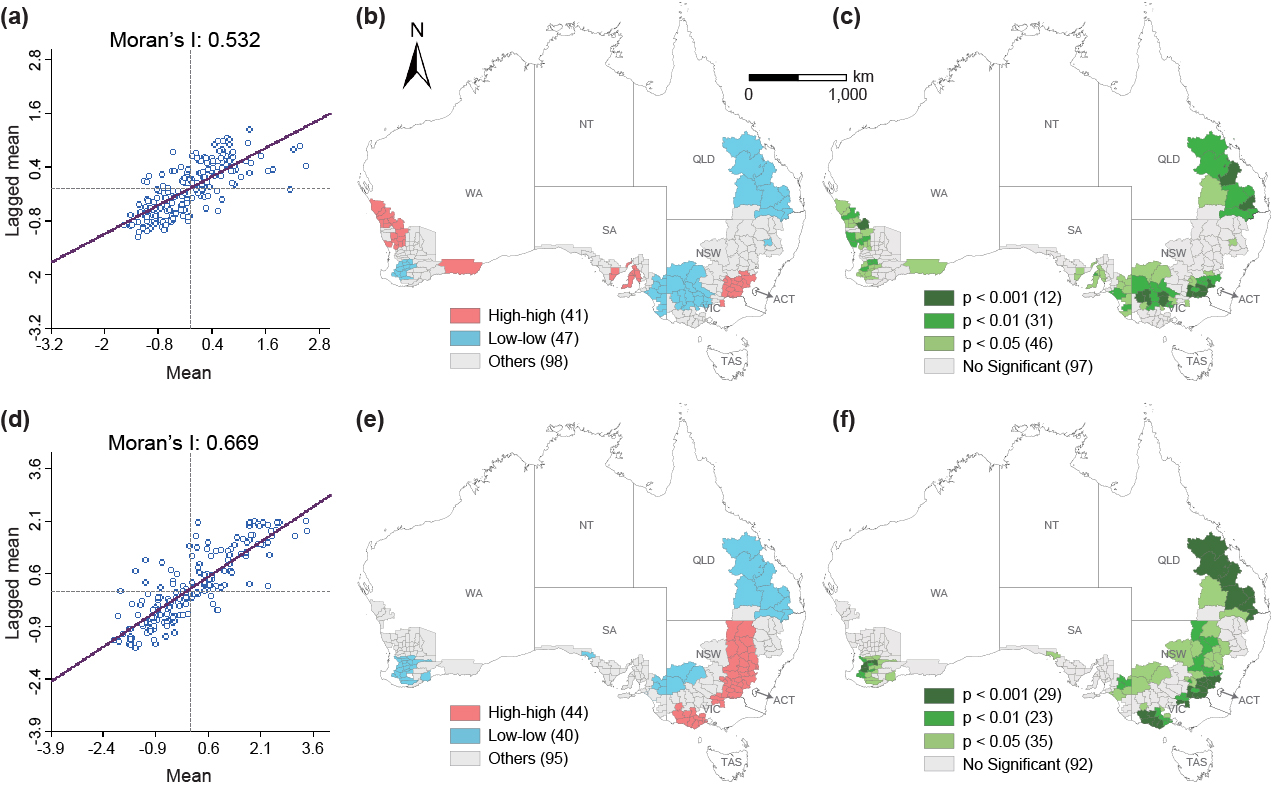
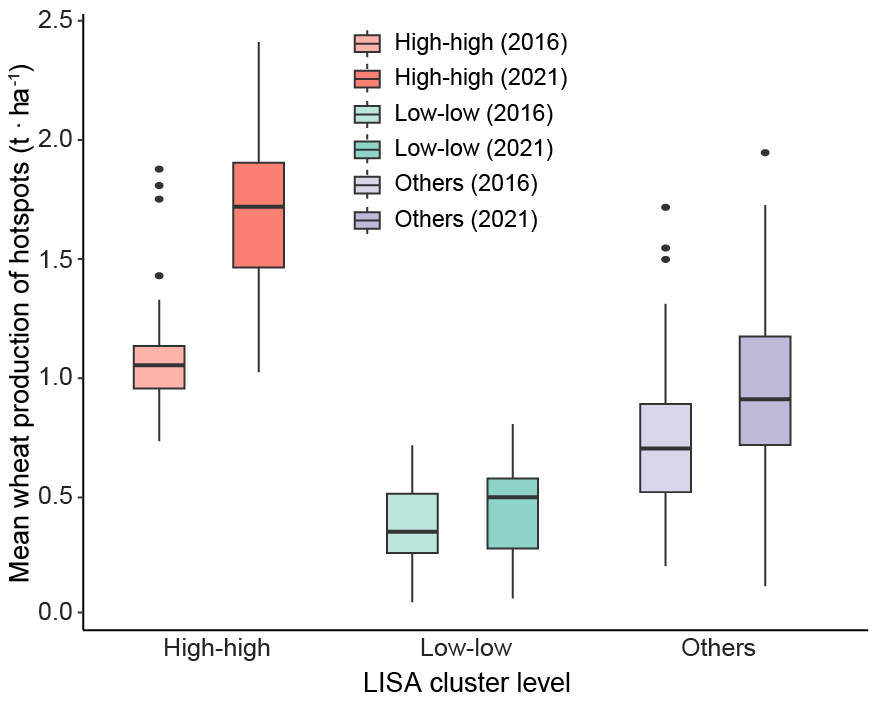
Identify spatial clustering in the response variable.
Global Moran's I is used to test whether wheat production is spatially clustered, while
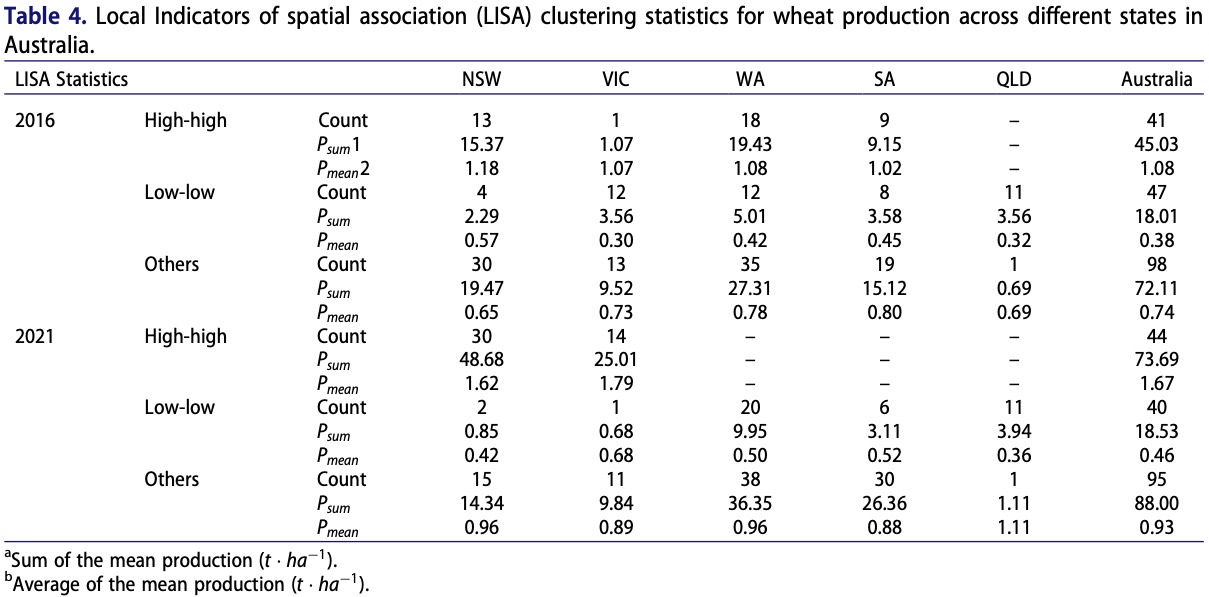
LISA/local Moran's I identifies hotspot, cold spot, and non-significant regions:
\[ I = \frac{ n\sum_{i=1}^{n}\sum_{j=1}^{n}w_{ij}(x_i-\bar{x})(x_j-\bar{x}) }{ \sum_{i=1}^{n}\sum_{j=1}^{n}w_{ij}\sum_{i=1}^{n}(x_i-\bar{x})^2 } \]\[ I_i = \frac{x_i-\bar{x}}{s^2} \sum_{j=1}^{n}w_{ij}(x_j-\bar{x}) \]
-
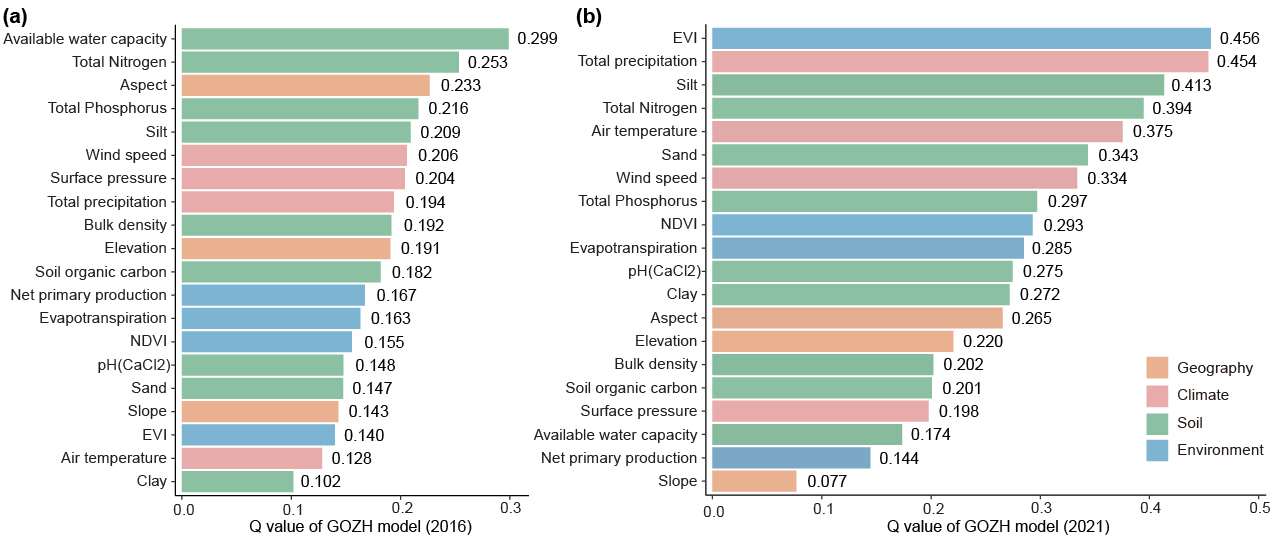
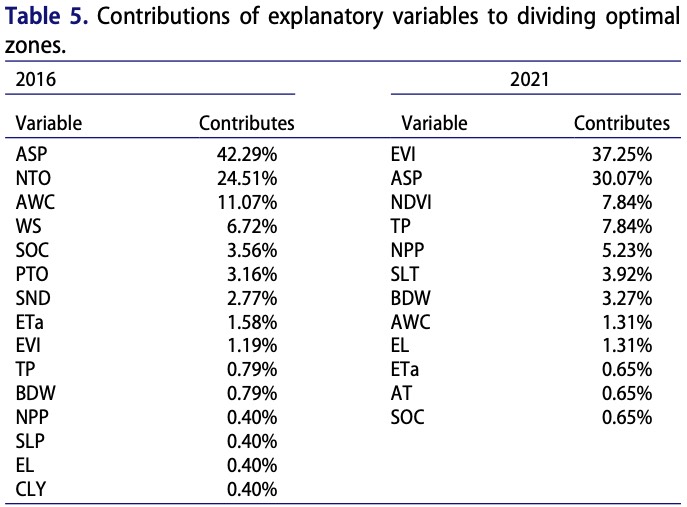
Measure the explanatory power of individual determinants.
The geographical detector framework evaluates how strongly each stratified
explanatory variable explains wheat production using the power of determinants (PD):
\[ PD = 1 - \frac{\sum_{z=1}^{h}N_z\sigma_z^2}{N\sigma^2} = 1 - \frac{SSW}{SST} \]A larger PD indicates stronger explanatory power for the spatial heterogeneity of wheat production.
-
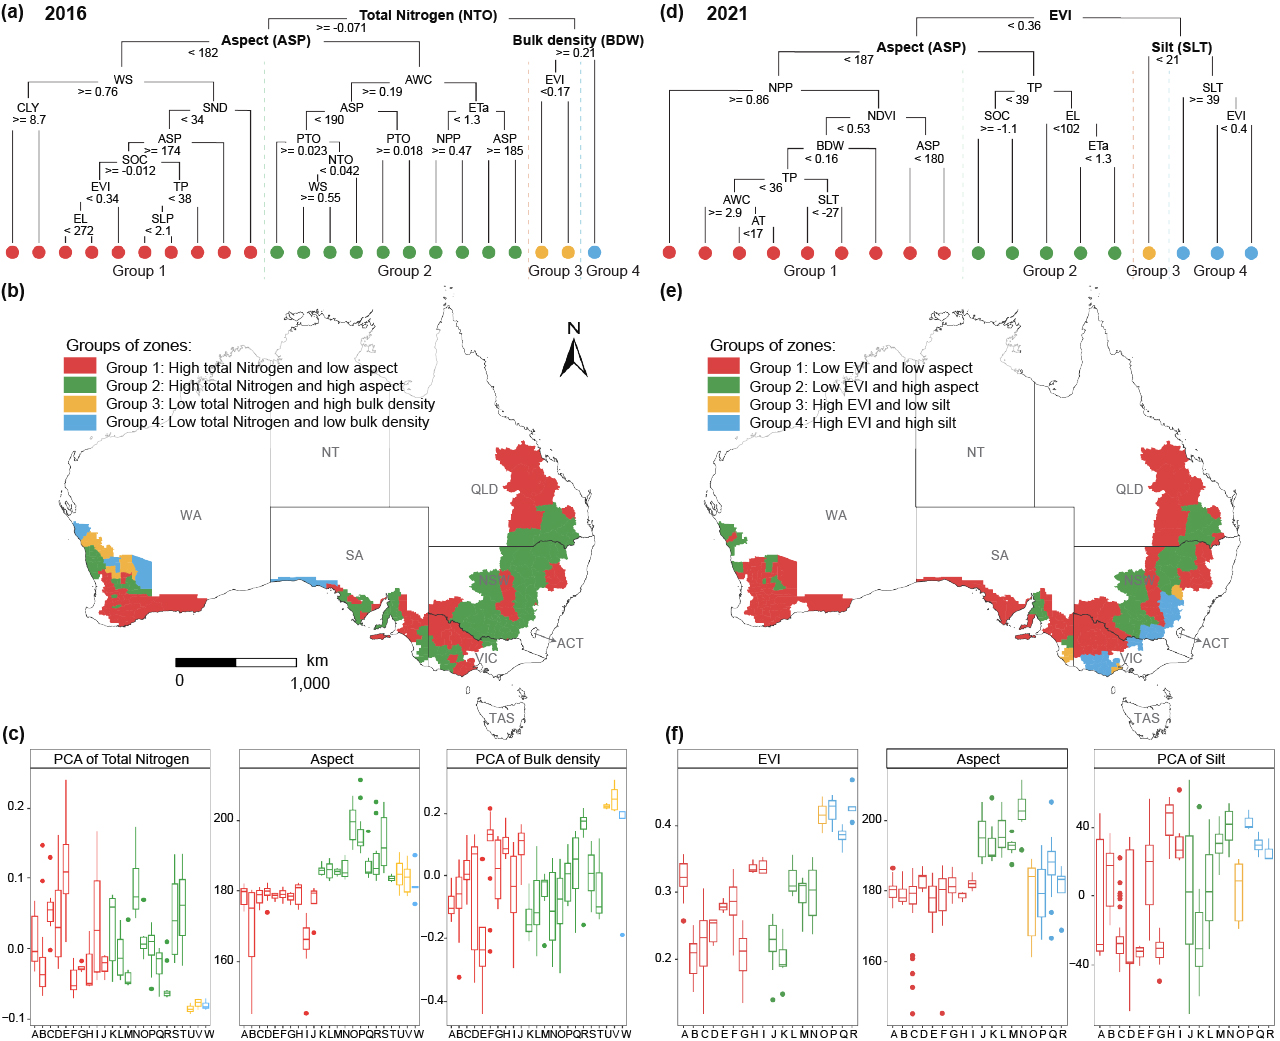
Delineate geographically optimal zones with GOZH.
GOZH uses decision-tree-based spatial discretization to search for zones that maximize
between-zone differences while minimizing within-zone variation. Its optimal power of
determinants is written as:
\[ \Omega = \max(PD) = \gamma(X,D) = 1 - \frac{\min(SSW_{X,D})}{SST} \]\[ \min(SSW_{X,D}) = \min\left\{ \sum_{z=1}^{h}\sum_{j=1}^{N_z}(y_{zj}-\bar{c}_z)^2 \right\} \]In the wheat case study, LGAs are recursively split with the 20 explanatory variables, using a minimum node size of 10 LGAs to avoid excessive partitioning.
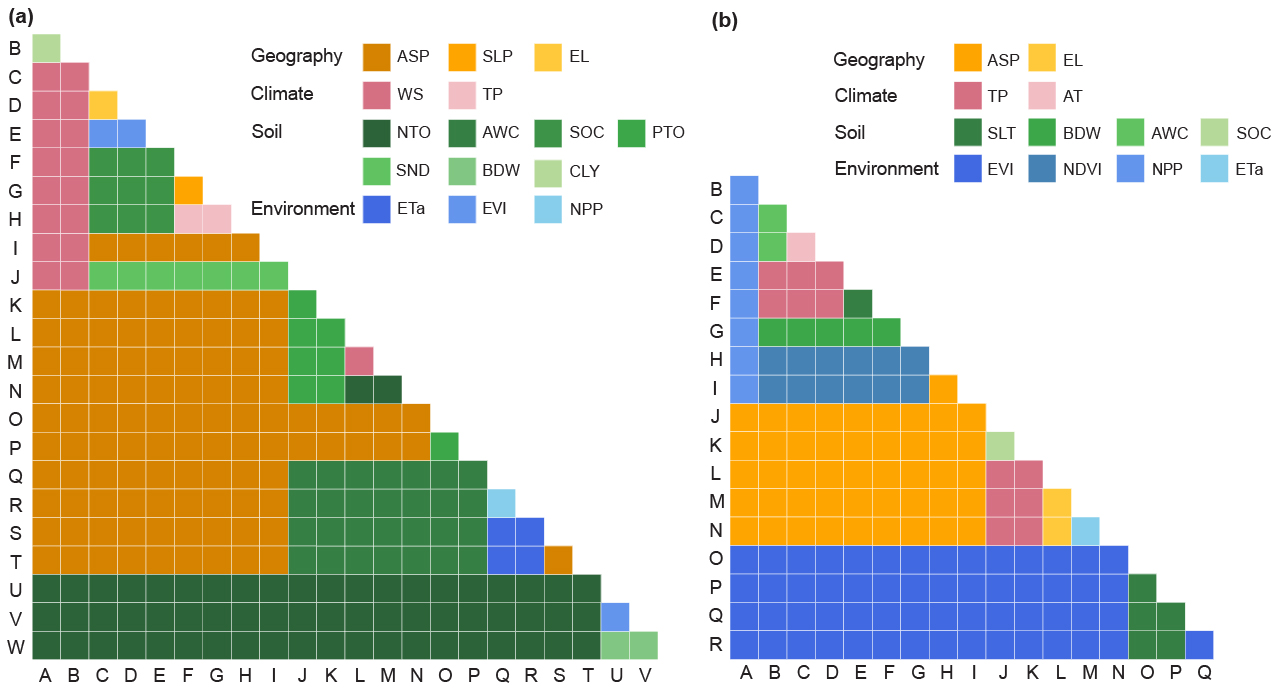
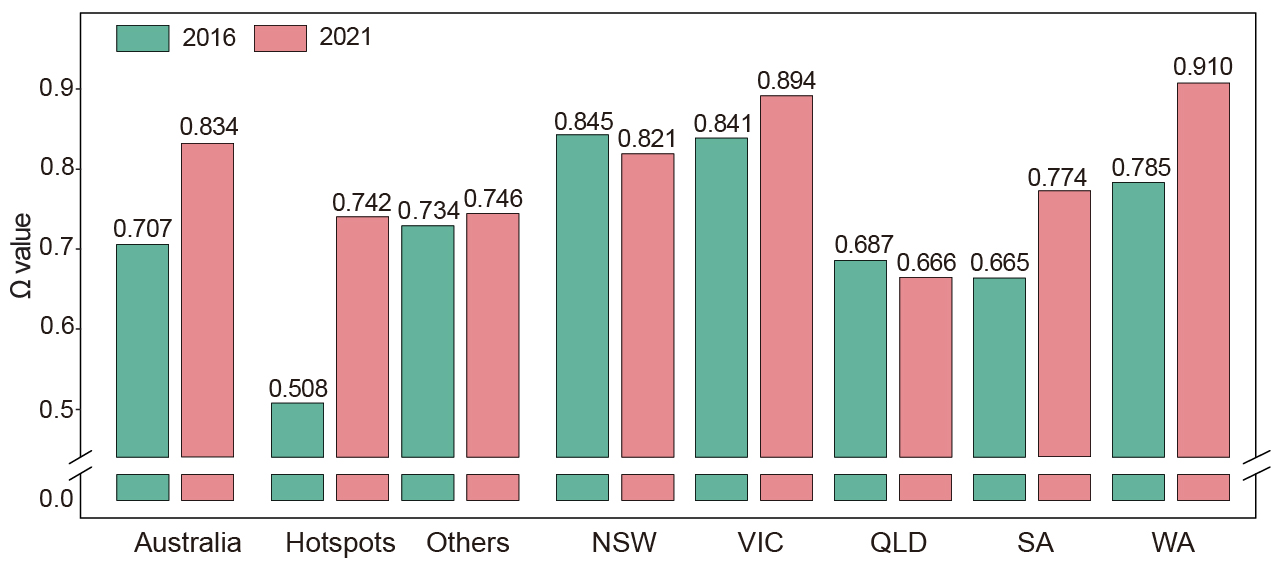
- Evaluate interaction effects at multiple spatial scales. The GOZH model is run for Australia as a whole, hotspot and non-hotspot regions, and individual states. The resulting \(\Omega\) values quantify the combined influence of geographic, climatic, soil, and environmental determinants under different spatial contexts.
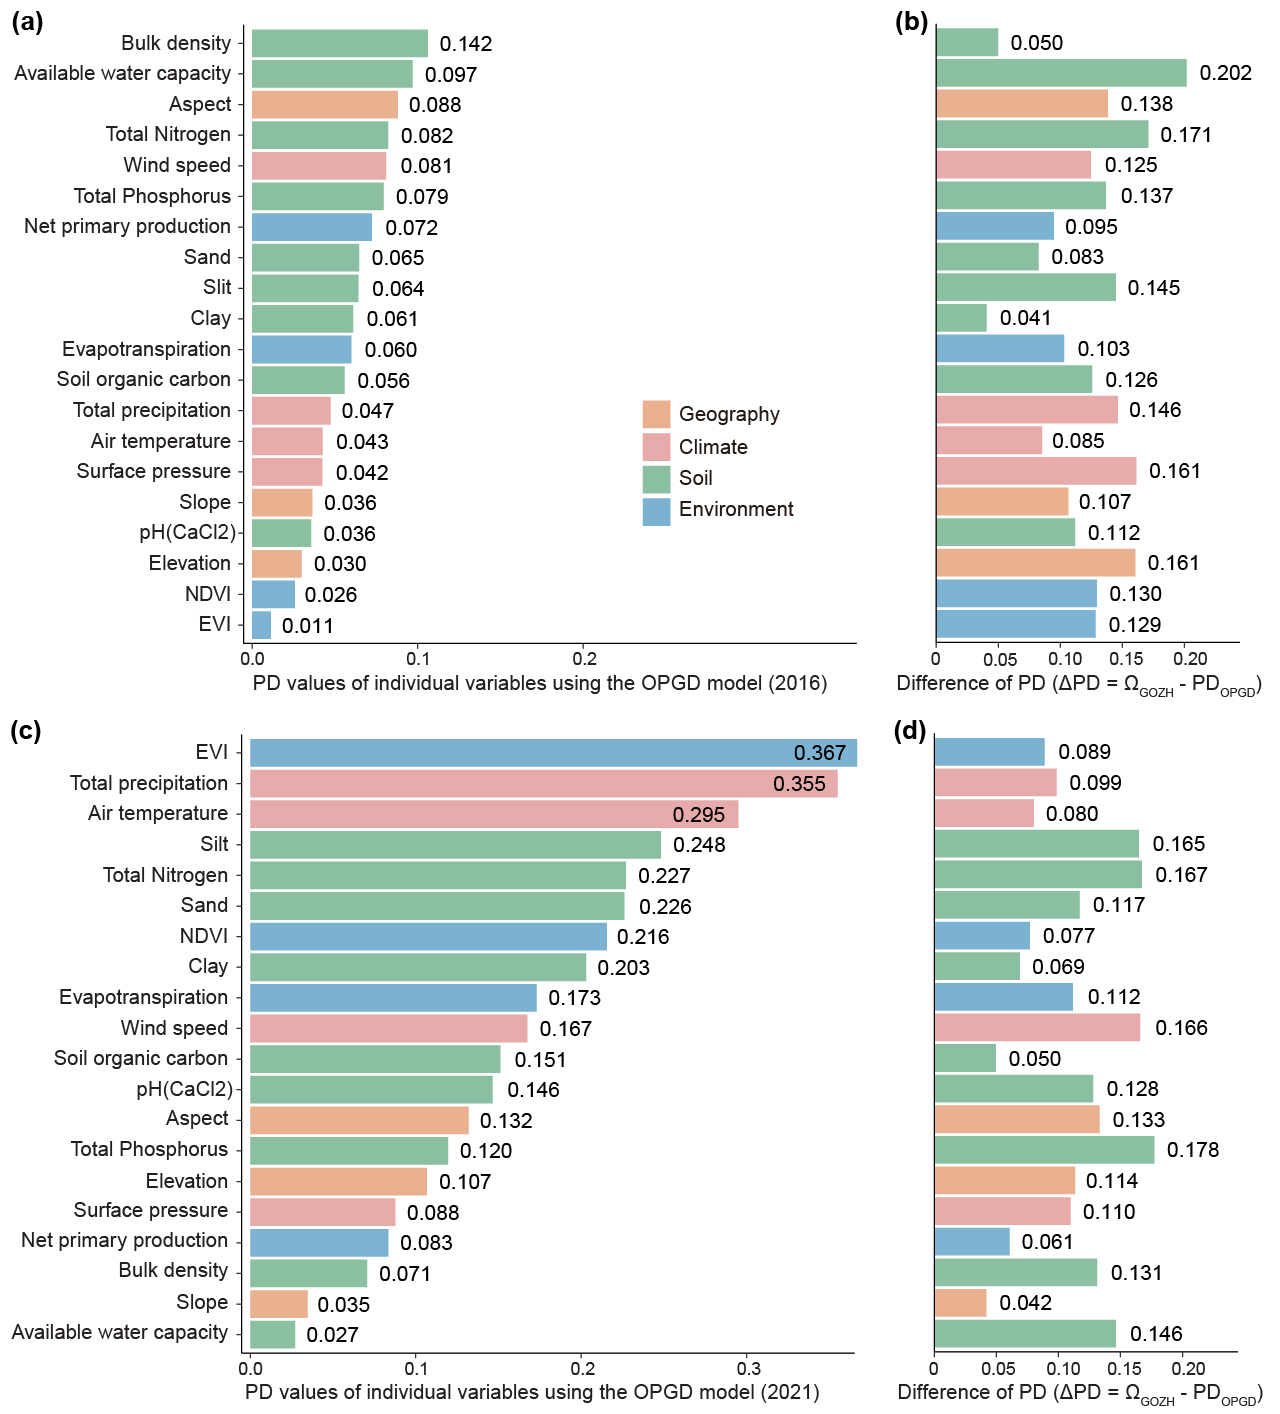
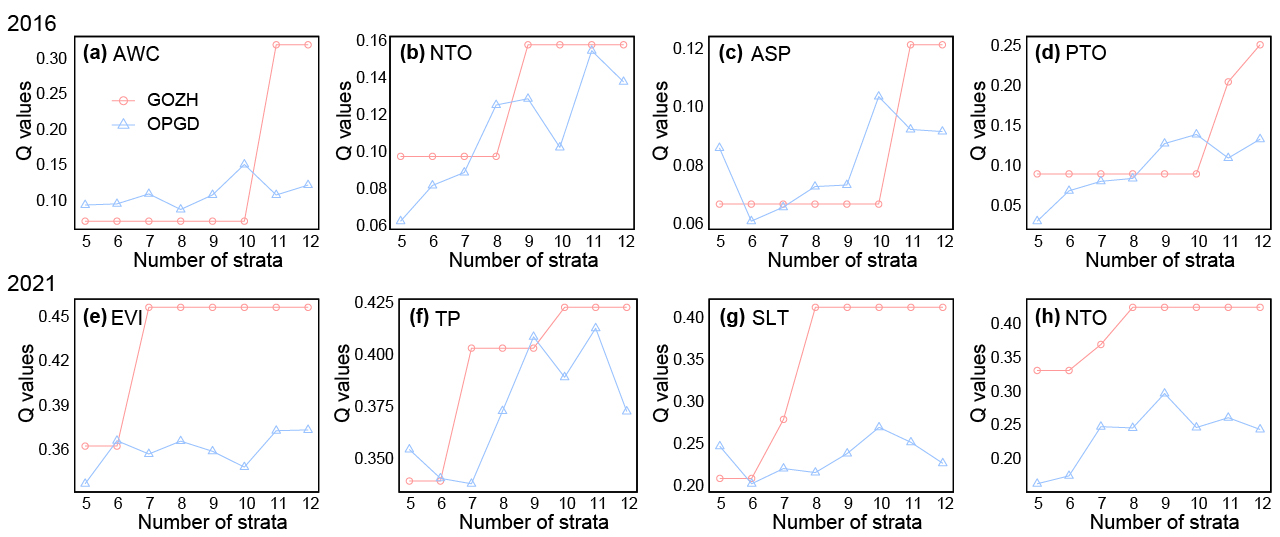
- Validate the model against OPGD. The same response and explanatory variables are analyzed with the optimal parameters-based geographical detector (OPGD). GOZH and OPGD are compared through individual-variable PD values, principal-variable stratification curves, and overall PD values to assess whether GOZH better explains wheat-production disparities.
Figures and Tables
Data Availability Statement
Data and codes supporting the findings of this study are available on Figshare.
Funding
This research was funded by the National Key Research and Development Program of China (2023YFB3907403) and supported by the China Scholarship Council (Grant No. 202206300058).